Travel Map With Basemap
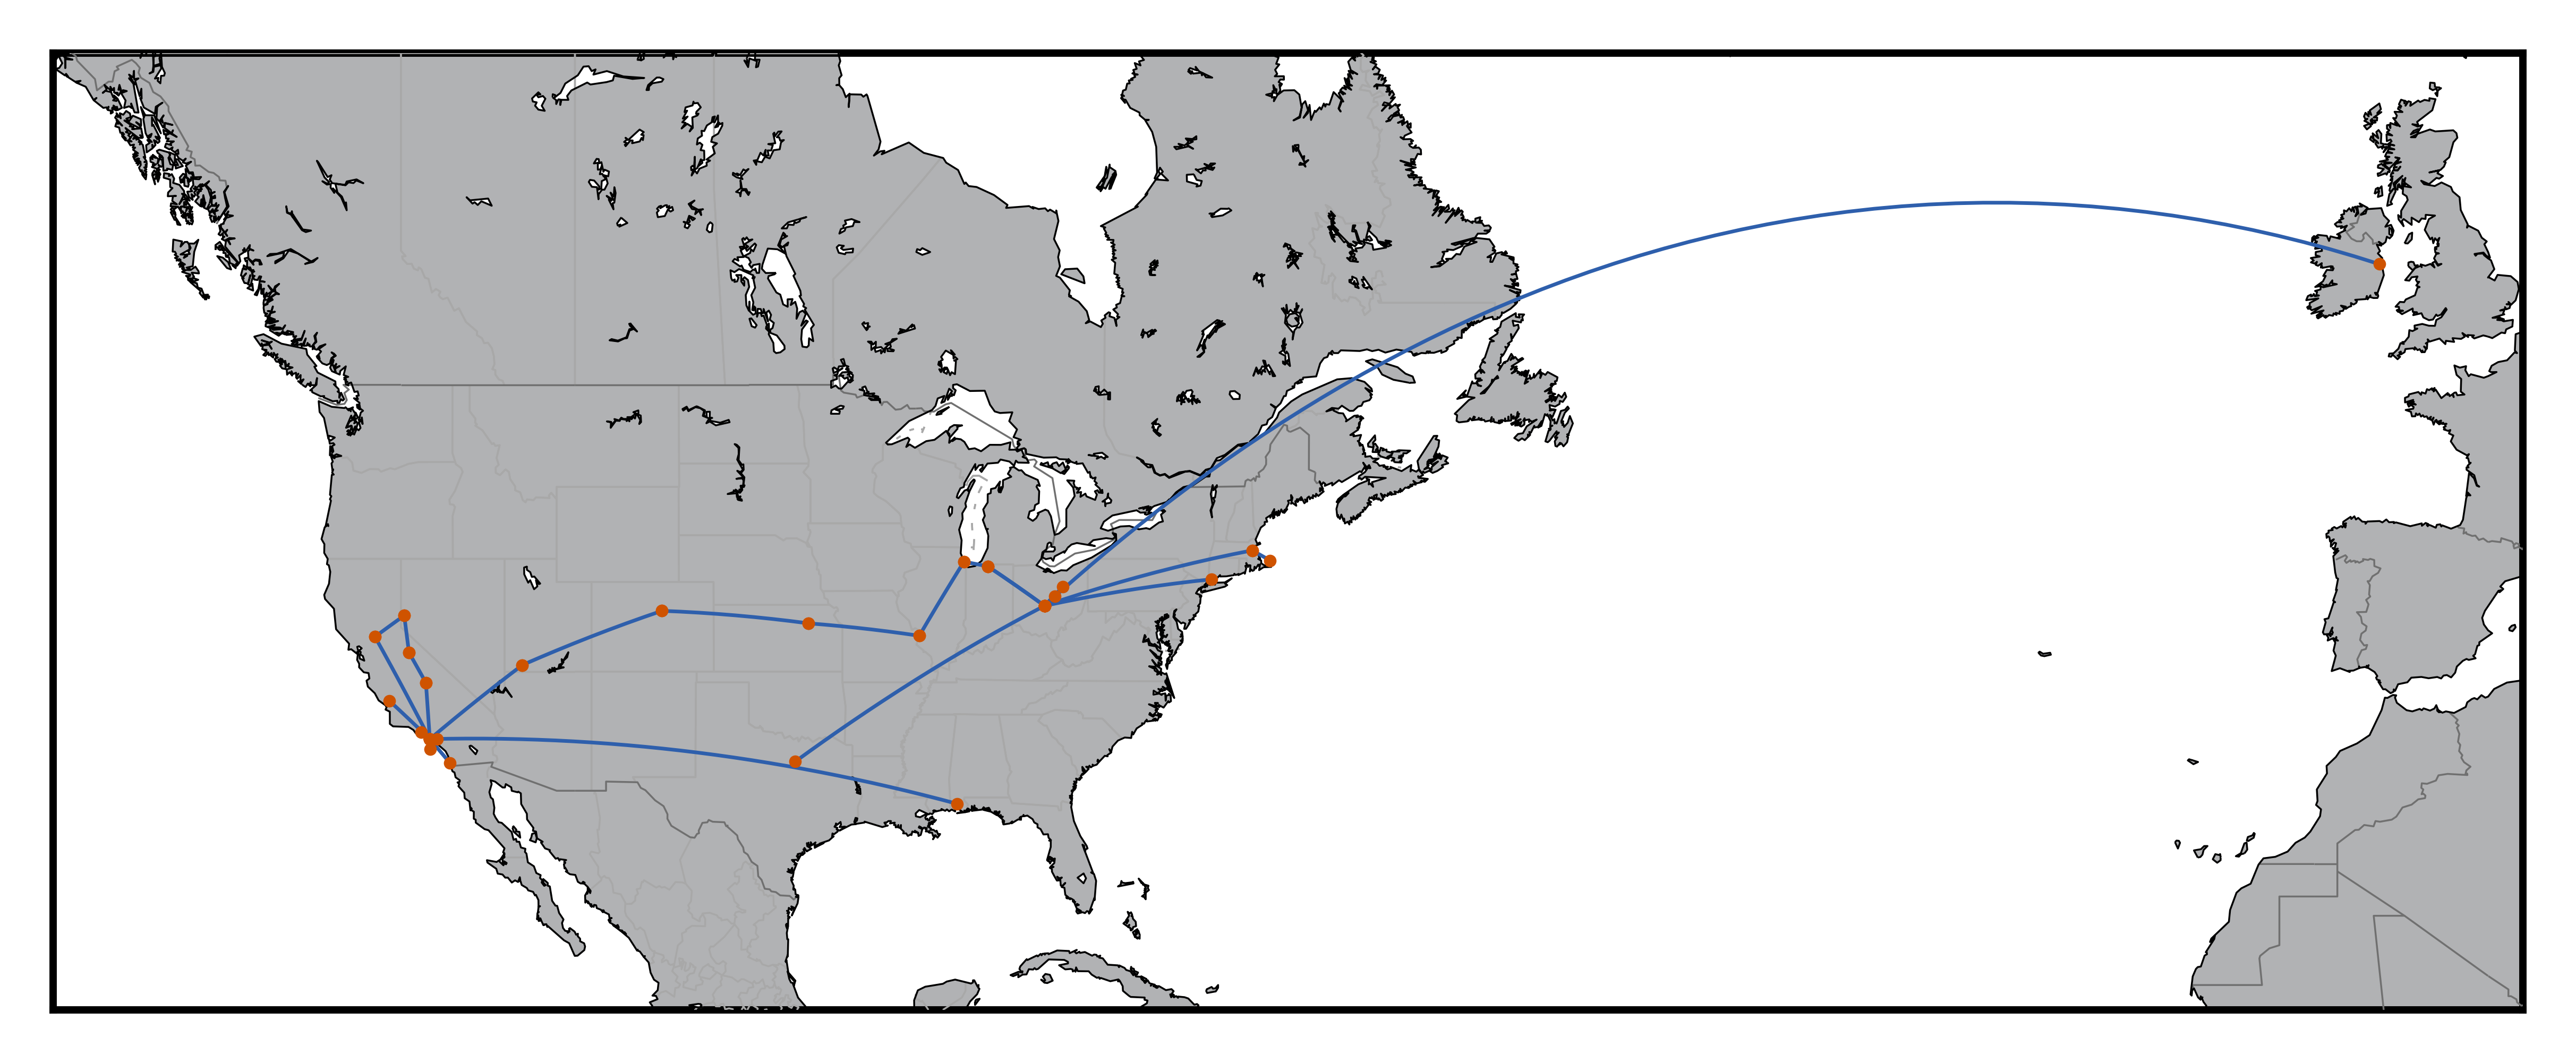
For me 2016 was quite a year for travel: a cross-country road trip, visiting family in Alabama, and a trip to Europe for work. In this example I'll show how to illustrate a year of travel using Python's Basemap library.
Basemap was written by the Jeff Whitaker to visualize weather patterns. Since Basemap is written on top of matplotlib you are able to add to maps just as you would add to any other matplotlib figure.
Data Preparation
Since we will be plotting great circle lines of travel the data required is a simple list of origin and destination points with latitude and longitude coordinates.
{% notebook downloads/notebooks/travel-map-basemap/Basemap.ipynb cells[:1] %}
Installing Basemap
Installing Basemap was more of an adventure than I thought it would be. Take a look at the download page on the Basemap documentation, or my notes on how I got it installed for help.
Plot with Basemap
Once Basemap is installed, plotting is relatively straightforward. Glancing through the examples is helpful for seeing the parameters to work with.
%matplotlib inline
from mpl_toolkits.basemap import Basemap
import matplotlib.pyplot as plt
import numpy as np
import os
import pandas as pd

df = pd.read_csv('2016_travel.csv')

# Basemap parameter options here: http://matplotlib.org/basemap/api/basemap_api.html
lat_0 = 0
lon_0 = 0
llcrnrlat = 20
llcrnrlon = -140
urcrnrlat = 65
urcrnrlon = 20

fig=plt.figure()
m = Basemap(projection='merc',
            lat_0=lat_0, lon_0=lon_0, lat_ts=20, area_thresh=500,
            llcrnrlon=llcrnrlon,llcrnrlat=llcrnrlat,urcrnrlon=urcrnrlon,urcrnrlat=urcrnrlat,
            resolution='l')

m.drawmapboundary(fill_color='#FFFFFF')
m.fillcontinents(color='#B1B2B4',lake_color='#FFFFFF',zorder=0)

m.drawcoastlines(linewidth=0.25, zorder=8)
m.drawstates(linewidth=0.25, color='#A8A8A8', zorder=6)
m.drawcountries(linewidth=0.25, color='#707070', zorder=7)

lat_orig = 35.639255
lng_orig = -120.713308
lat_des  = 39.961
lng_des  = -82.999

for row in range(0,df.shape[0]):
    lat_orig = df.iloc[row,1]
    lng_orig = df.iloc[row,2]
    lat_des  = df.iloc[row,4]
    lng_des  = df.iloc[row,5]
    m.drawgreatcircle(lon1=lng_orig, lat1=lat_orig, lon2=lng_des, lat2=lat_des,
                      linewidth=.5,color='#2E5FAC', zorder=9)
    x, y = m(lng_orig,lat_orig)
    m.scatter(x,y,2,marker='.',edgecolors='#CF5300',c='#CF5300', zorder=10)
    x, y = m(lng_des,lat_des)
    m.scatter(x,y,2,marker='.',edgecolors='#CF5300',c='#CF5300', zorder=10)

plt.show()
fig.savefig('2016_travel.png', dpi=1000, bbox_inches='tight')
Closing Thoughts
I like the output and plan to do this for future years.
Cartopy Update
As an update, the Basemap project has moved over to Cartopy, so I may try to generate the same map in Cartopy in the future. From the Basemap documentation:
Starting in 2016, Basemap came under new management. The Cartopy project will replace Basemap, but it hasn’t yet implemented all of Basemap’s features. All new software development should try to use Cartopy whenever possible, and existing software should start the process of switching over to use Cartopy. All maintenance and development efforts should be focused on Cartopy.