Standard Maps with Cartopy

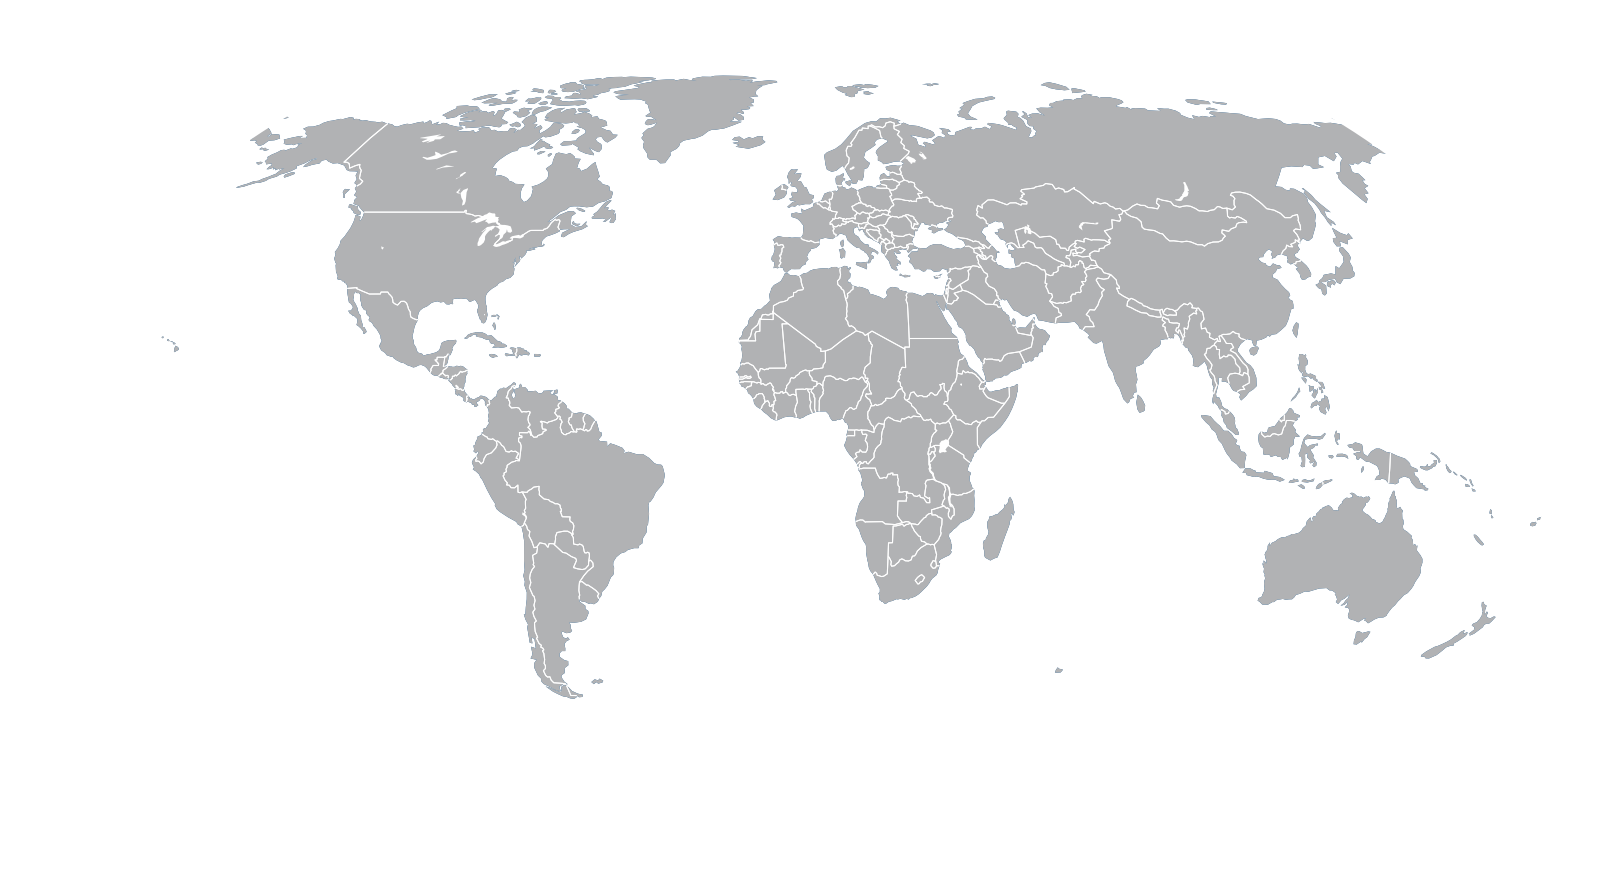
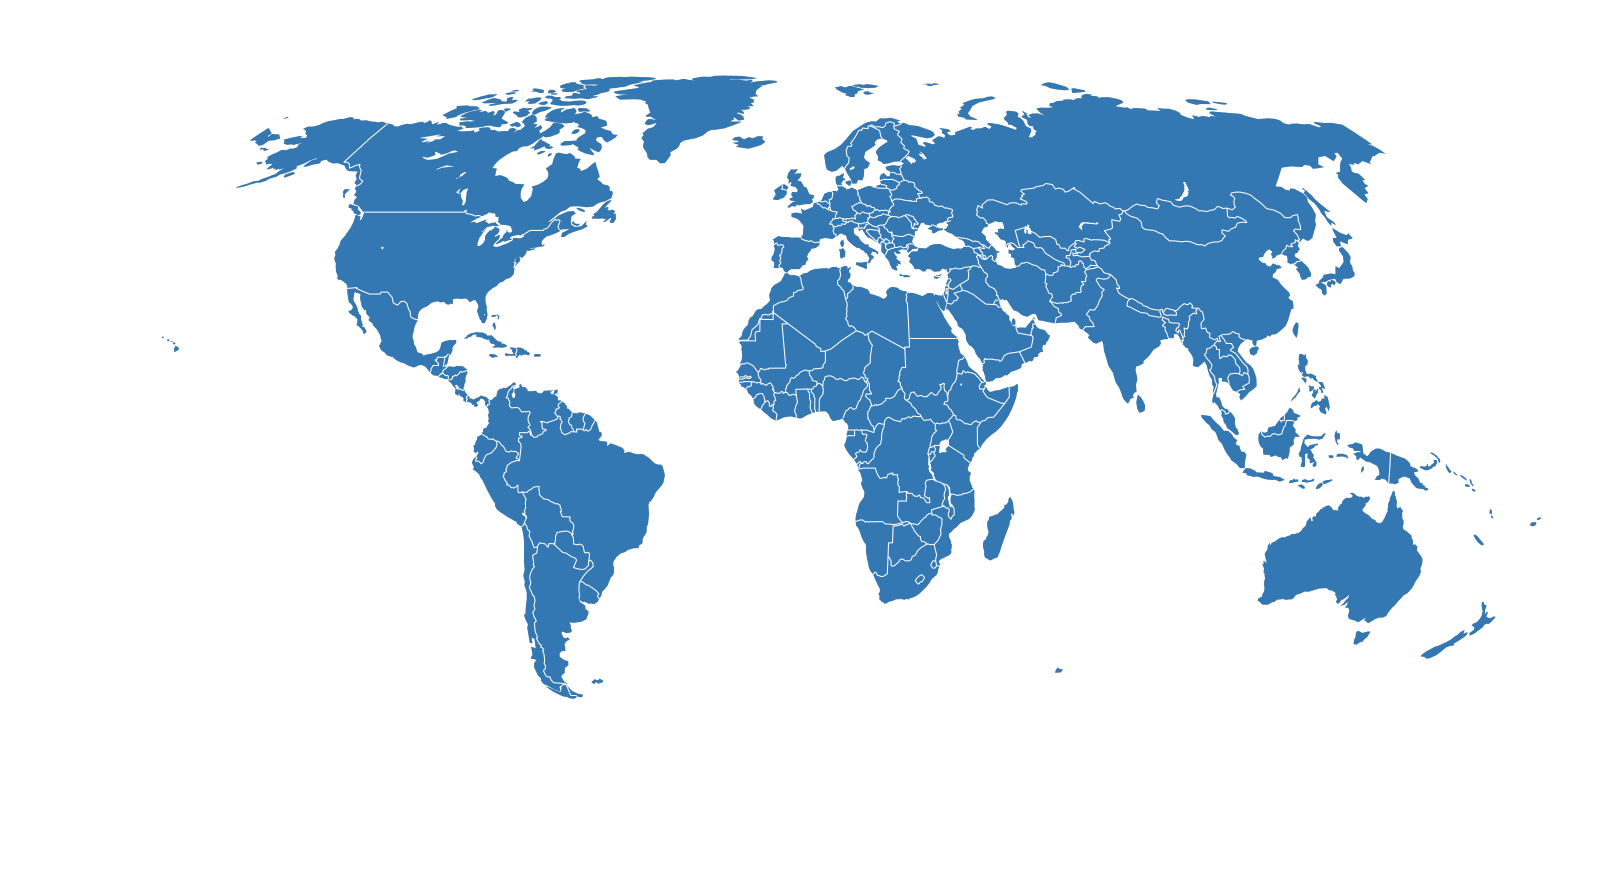
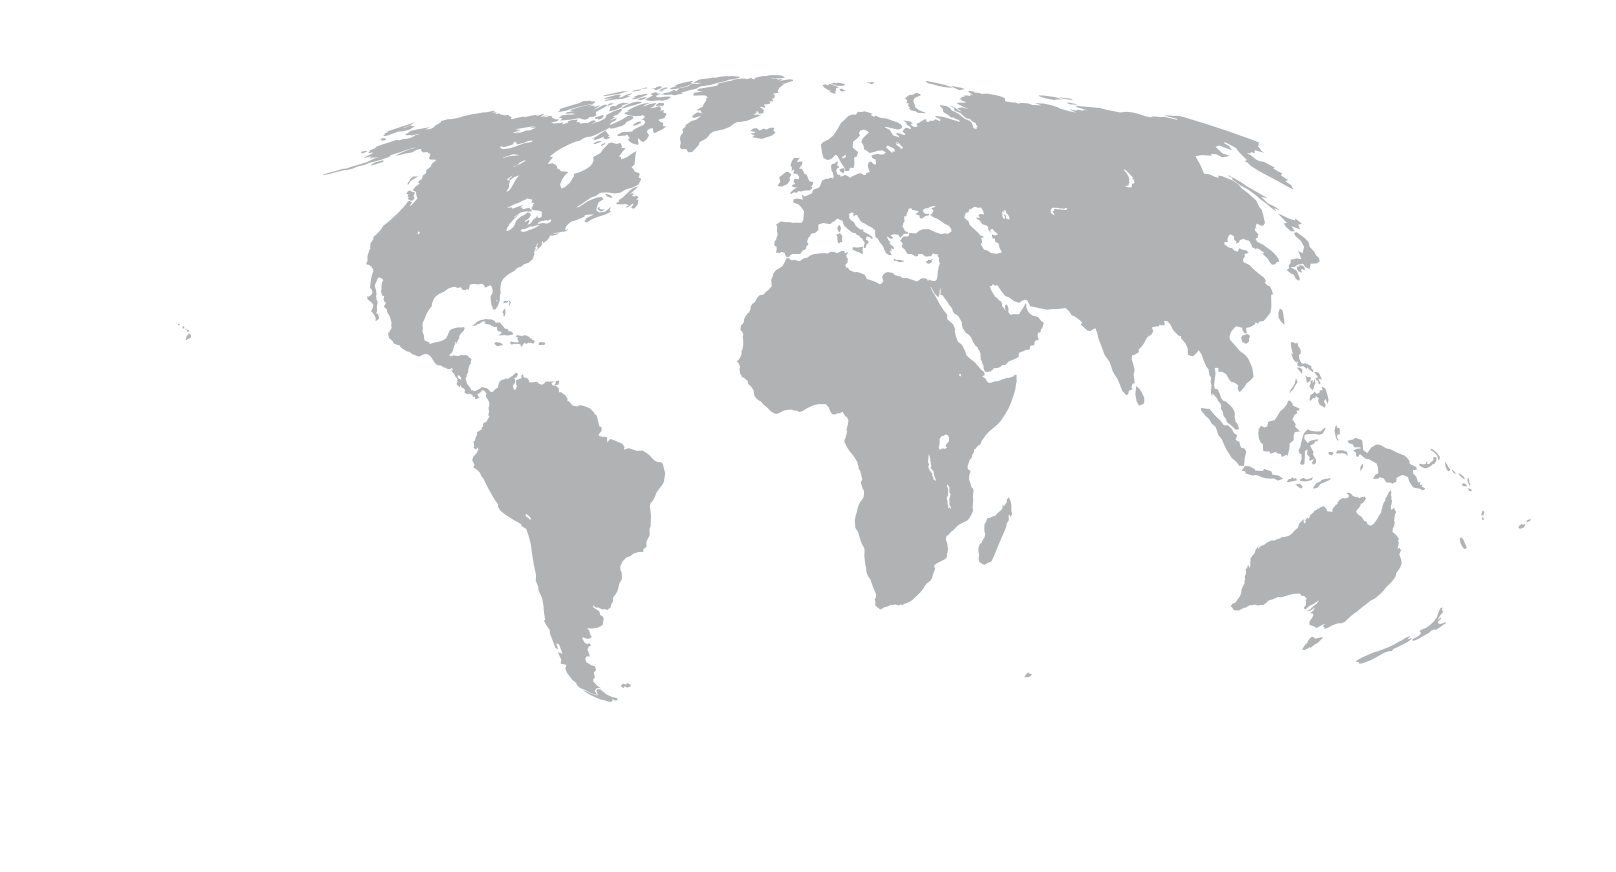
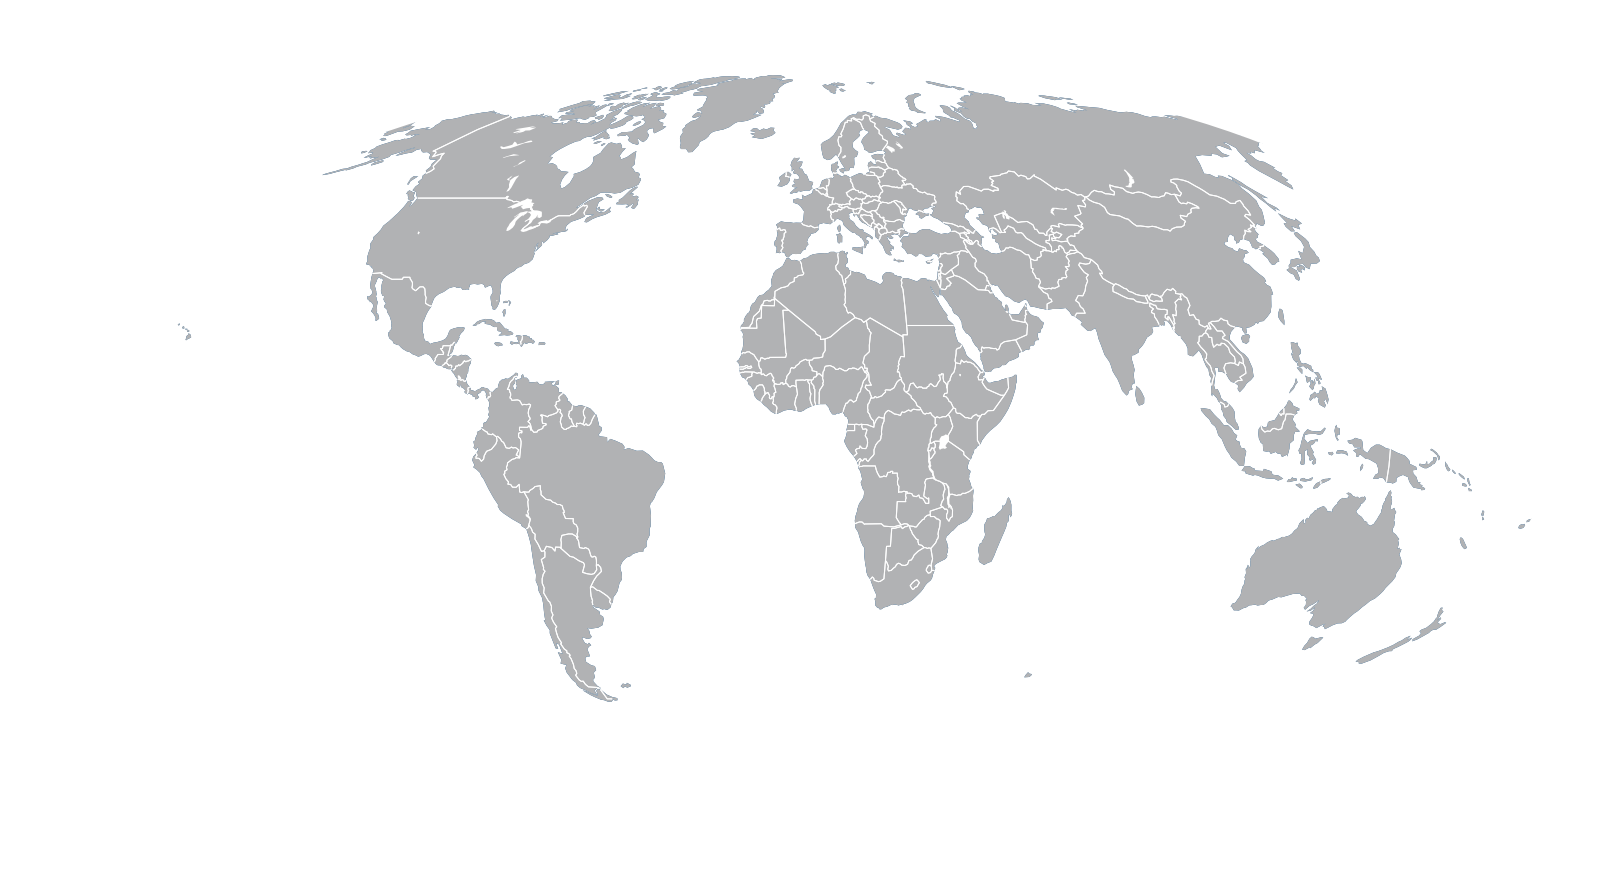
Here are some examples of base world maps (excluding Antarctica which is cropped out) using Cartopy.
Robinson Projection
These examples use the Robinson projection.
import matplotlib.pyplot as plt
import cartopy
import cartopy.crs as ccrs


def main():

    # configure chart
    plt.close()
    plt.style.use('mag')

    ax = plt.axes(projection=ccrs.Mollweide())

    ax.add_feature(cartopy.feature.LAND, zorder=0, linewidth=.001,
               facecolor='#B1B2B4')
    ax.add_feature(cartopy.feature.OCEAN, facecolor='white')
    ax.set_global()
    ax.outline_patch.set_edgecolor('white')

    # grey
    title = 'maps/world_Mollweide_grey.png'
    plt.savefig(title, bbox_inches='tight', pad_inches=.2, dpi=300)
    print('Saved: {}'.format(title))

    # blue
    ax.add_feature(cartopy.feature.LAND, zorder=0, facecolor='#3377b3', linewidth=.001)
    title = 'maps/world_Mollweide_blue.png'
    plt.savefig(title, bbox_inches='tight', pad_inches=.2, dpi=300)
    print('Saved: {}'.format(title))

    # blue countries
    ax.add_feature(cartopy.feature.BORDERS, edgecolor='white', linewidth=.25)
    title = 'maps/world_Mollweide_blue_countries.png'
    plt.savefig(title, bbox_inches='tight', pad_inches=.2, dpi=300)
    print('Saved: {}'.format(title))

    # grey countries
    ax.add_feature(cartopy.feature.LAND, zorder=0, facecolor='#B1B2B4', linewidth=.001)
    ax.add_feature(cartopy.feature.BORDERS, edgecolor='white', linewidth=.25)
    title = 'maps/world_Mollweide_grey_countries.png'
    plt.savefig(title, bbox_inches='tight', pad_inches=.2, dpi=300)
    print('Saved: {}'.format(title))


if __name__ == '__main__':
    main()

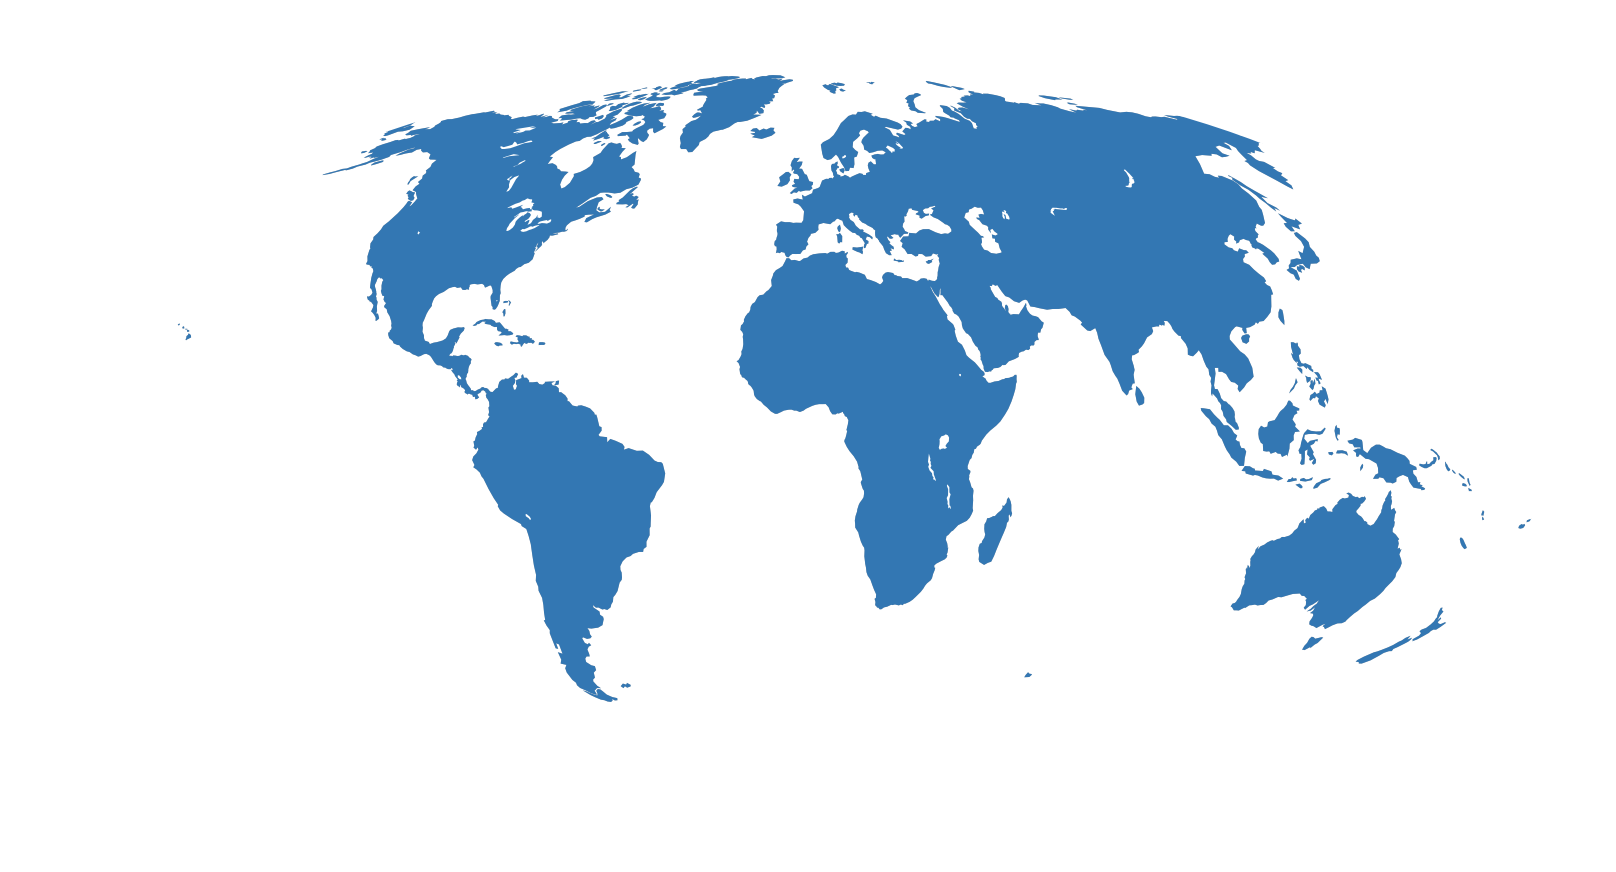
Mollweide Projection
These examples use the Mollweide projection. The code is the same for this but uses ax = plt.axes(projection=ccrs.Mollweide()) for the Mollweide projection.

Library versions:
cartopy     0.16.0
matplotlib  2.2.2