Highlighting States With Cartopy
Here is how to highlight select US States with Cartopy. (You can also highlight select countries with Cartopy.)
Define which states to highlight in states.csv, and run states.py:
import matplotlib.patches as mpatches
import matplotlib.pyplot as plt
import shapely.geometry as sgeom
import cartopy.crs as ccrs
import cartopy.io.shapereader as shpreader
import pandas as pd
# derived from this example: https://scitools.org.uk/cartopy/docs/v0.15/examples/hurricane_katrina.html
def plot_states(df,projection,colors,annotation,title,edgecolor):
ax = plt.axes([0, 0, 1, 1],
projection=projection)
ax.background_patch.set_visible(False)
ax.outline_patch.set_visible(False)
ax.set_extent([-125, -66.5, 20, 50], ccrs.Geodetic())
shapename = 'admin_1_states_provinces_lakes_shp'
shpfilename = shpreader.natural_earth(resolution='110m',
category='cultural', name=shapename)
reader = shpreader.Reader(shpfilename)
states = reader.records()
values = list(df[title].unique())
for state in states:
attribute = 'name'
name = state.attributes[attribute]
# get classification
try:
classification = df.loc[state.attributes[attribute]][title]
except:
pass
ax.add_geometries(state.geometry, ccrs.PlateCarree(),
facecolor=(colors[values.index(classification)]),
label=state.attributes[attribute],
edgecolor='#FFFFFF',
linewidth=.25)
# legend
import matplotlib.patches as mpatches
handles = []
for i in range(len(values)):
handles.append(mpatches.Rectangle((0, 0), 1, 1, facecolor=colors[i]))
plt.legend(handles, values,
loc='lower left', bbox_to_anchor=(0.025, -0.0),
fancybox=True, frameon=False, fontsize=5)
# annotate
ax.annotate(annotation, xy=(0, 0), xycoords='figure fraction',
xytext=(0.0275, -0.025), textcoords='axes fraction',
horizontalalignment='left', verticalalignment='center', fontsize=4,
)
plt.title(title, fontsize=8)
title = title+'.png'
plt.savefig(title, bbox_inches='tight', pad_inches=.2, dpi=300)
print('Saved: {}'.format(title))
def main():
# df = pd.read_csv('states.csv')
df = pd.read_csv('states.csv', index_col='State')
# States Visited
projection = ccrs.LambertConformal()
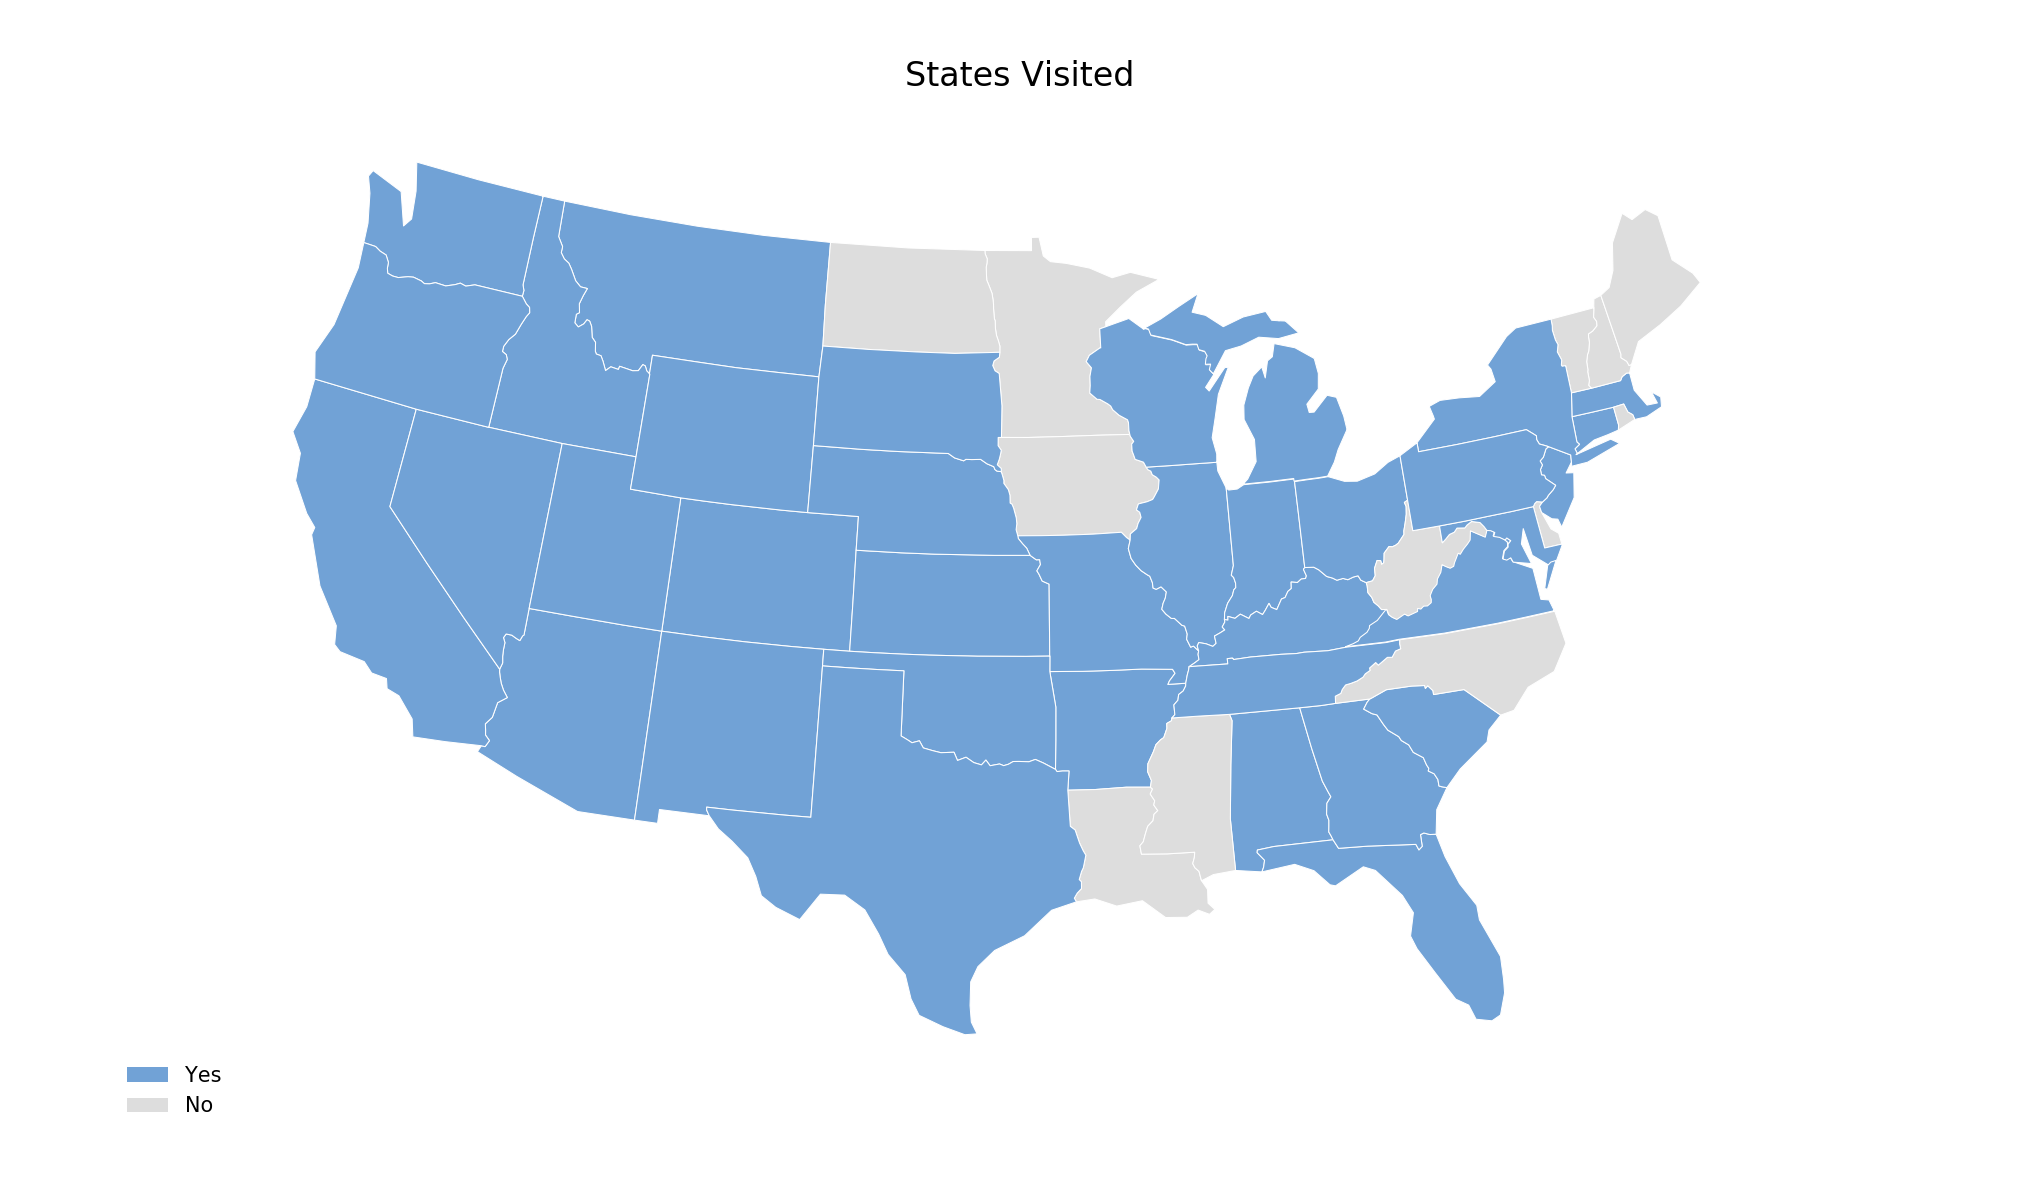
title = 'States Visited'
colors = ['#71a2d6','#DDDDDD']
annotation = ''
plot_states(df,projection,colors,annotation,title,edgecolor='white')
# 13 Original Colonies
projection = ccrs.LambertConformal()
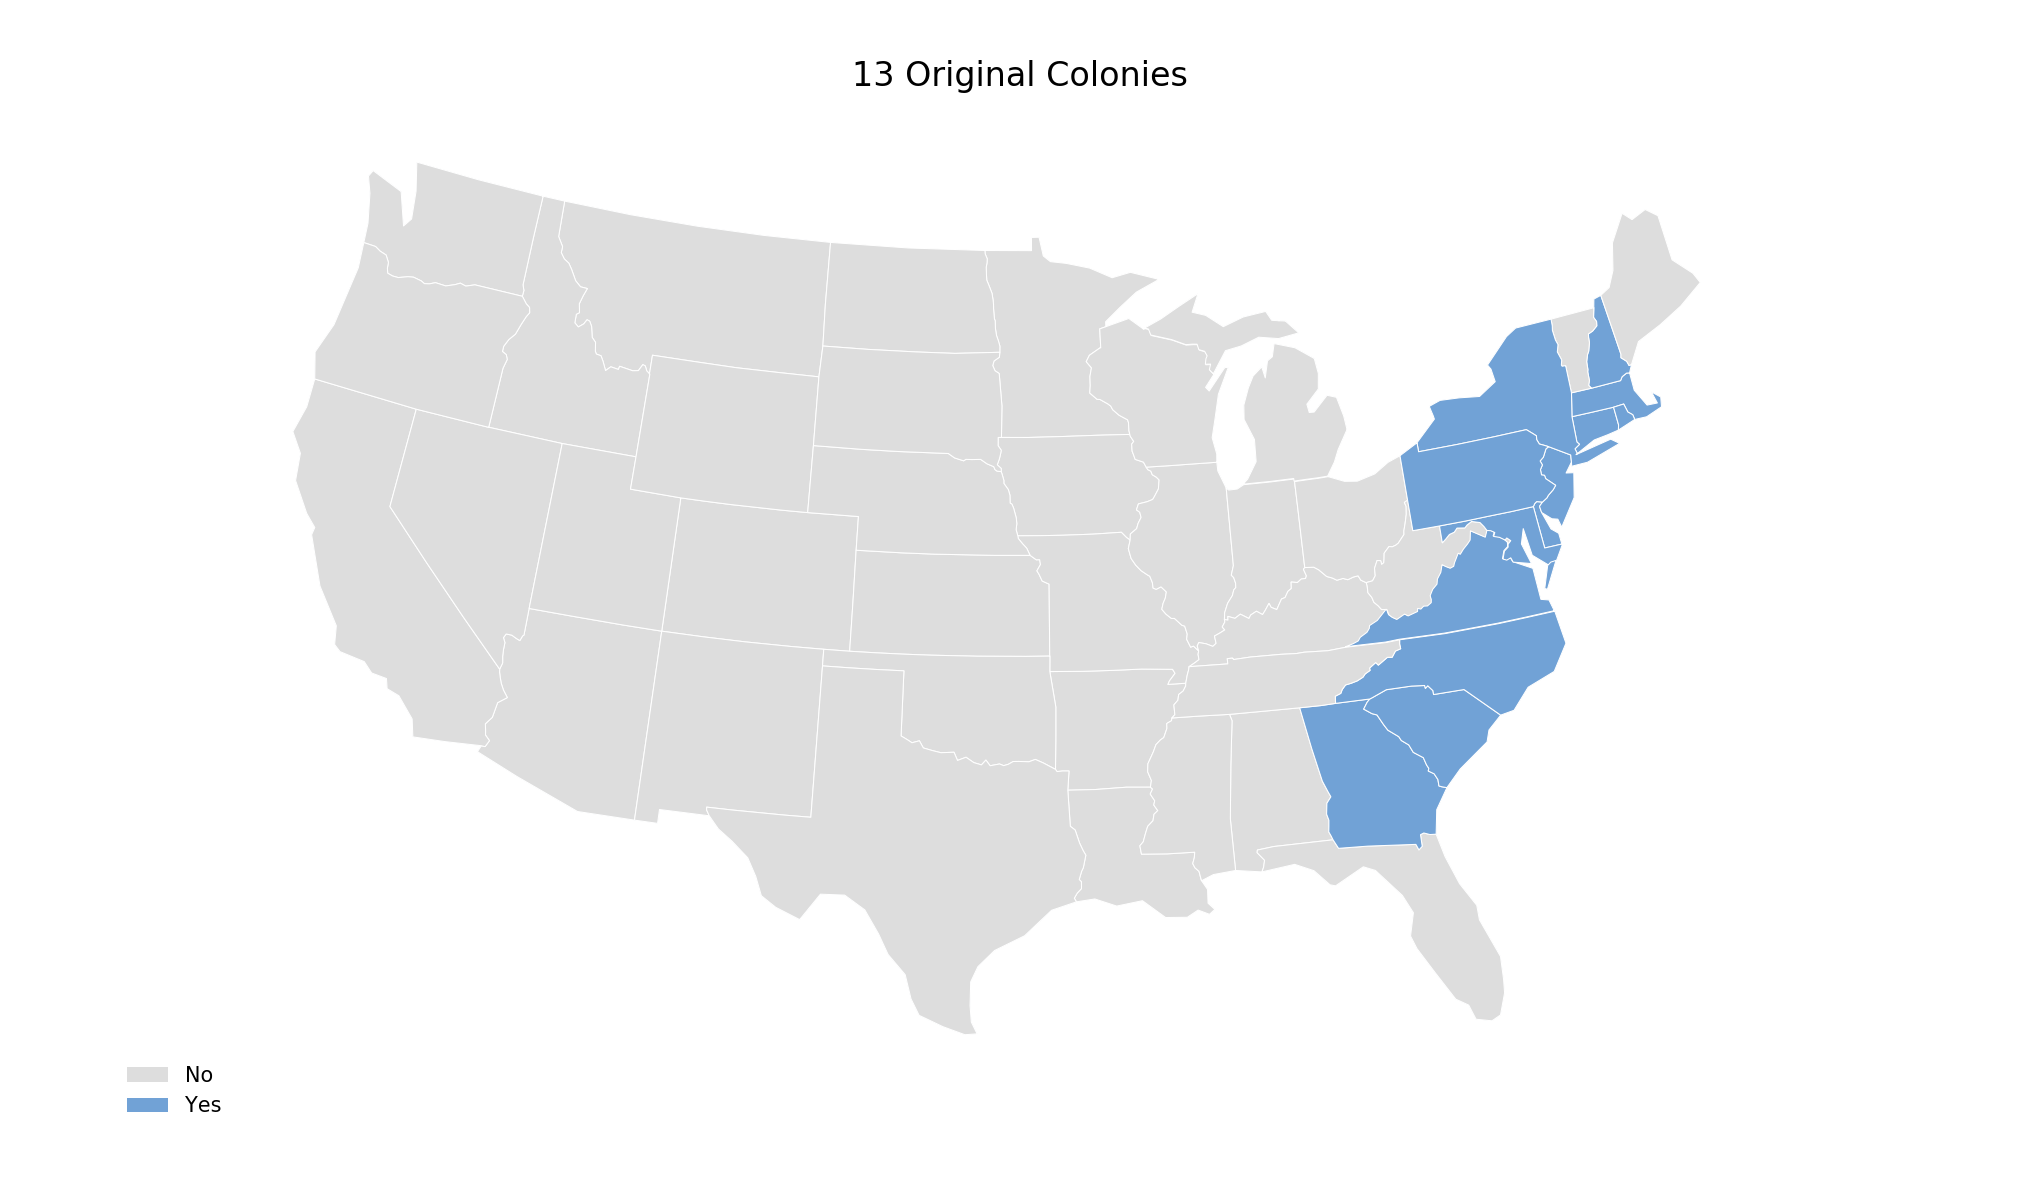
title = '13 Original Colonies'
colors = ['#DDDDDD','#71a2d6']
annotation = ''
plot_states(df,projection,colors,annotation,title,edgecolor='white')
print('Done.\n')
if __name__ == '__main__':
main()
For example, here are the 13 original colonies:
Or you can make a map of all states you have visited:
Note: This post may be helpful for adding Alaska and Hawaii.